References for Restoration and Conservation

My passion for the science of Ecology and the practices of ecological restoration and conservation arose largely from time I spent on small, “postage stamp”, Iowa prairies. I still struggle to articulate the appeal, but for me there is something of meaning in complexity.
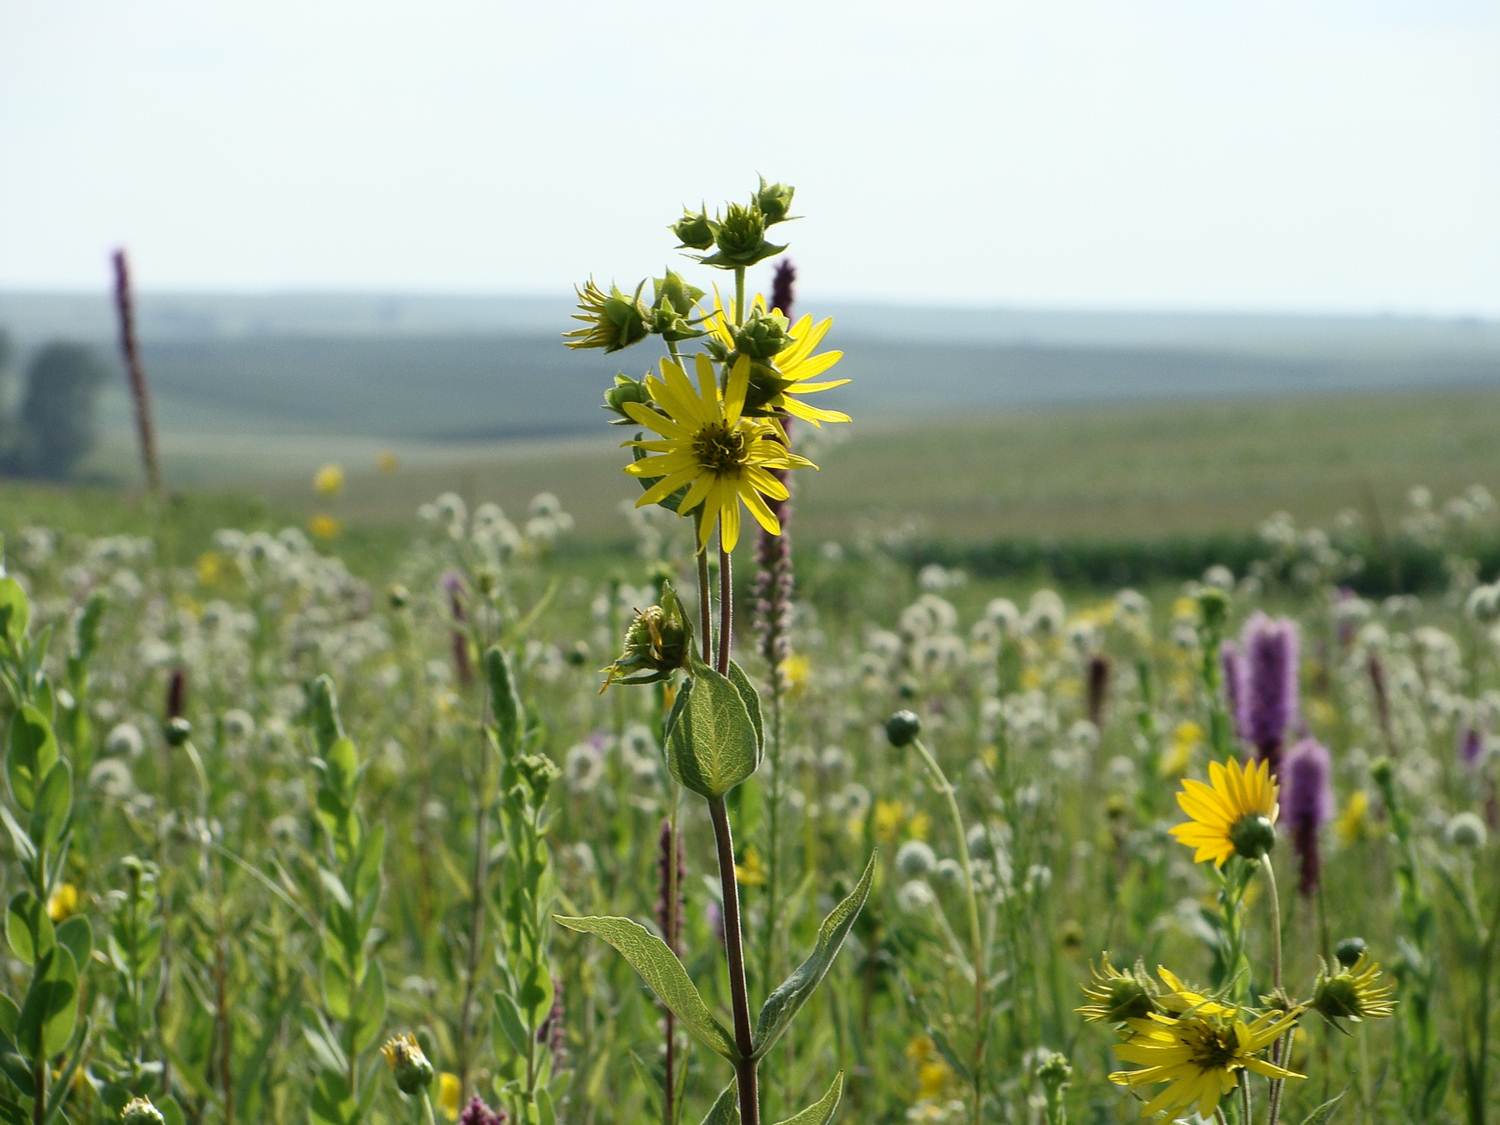
Owens prairie, an unbroken square of land on the five-figure per acre black soils of Iowa.

Owens prairie, an unbroken square of land on the five-figure per acre black soils of Iowa.

Having just defended a dissertation dedicated to restoration, I have been thinking about the remaining natural (or relatively natural) places many of us seek to conserve, and the degraded places we might wish to restore. I have been thinking about reference conditions, goals, and how much we really know about what we’re doing or would like to do.

We often use what remains as a reference for what we should conserve or restore. The prairie in the above picture is beautiful, a place where I would (and have) merrily strode about seeking to witness new and unfamiliar flora and fauna, but is this prairie like it used to be, and if it isn’t, should it be? Should our attempts to restore native vegetation nearby defer to the little square of land where this prairie clings to existence and its attendant environmental and landscape configuration? Unlike the prairies Willa Cather knew, so much of what we have left, regardless of how many open blossoms scream richness and beauty, is changed. It is changed by the deposition of nitrogen from surrounding fields and feed lots, the loss of native herbivores, the loss of the effects of predators on herbivore behavior, altered fire regimes, the population effects of isolation, increased atmospheric carbon dioxide, and on and on. Unfortunately, only rarely can we approach an understanding of how much things have changed. Are there more showy forbs than there should be (says a Kansan), or are there fewer (says an Iowan)? Some might argue to use more western prairies for reference, because they have been consistently grazed and more often burned, but others might argue that Iowa prairies have not been sprayed with broad-leaf herbicides at large scales or that European burning and grazing regimes are every bit as foreign as their omission. Not only have so many things changed, but conditions are changing, and they will change.

So we might look to the past for a reference. We might look to what we have now, even if it has changed, because it represents the evolution (in more than one sense of the word) of the historic system in response to change. We might take this further and consider how such change might be limited by isolation and the pace at which change occurs.

I tend to come down thinking about the future. I found myself defending species richness this last Monday, and the future is the primary reason why. In Iowa, there are still prairies. The species in the photograph above are attractive, and maybe change has inflated their richness at small scales, but what would be growing on Owens Prairie had those species not been there when the surrounding sod was turned over and the prairie was isolated? Would native plant species dominate and some of their rarer consumers (regal fritillaries can be found on this prairie) find adequate resources, or would this square of land more resemble the surrounding corn fields in terms of its complexity?

Richness originally called to me in a human way. It appeals to my sense of beauty and need to live in a textured world. I value sharing the story of a flower or bird with another person, and for someone like me, it forms the nucleus of human interaction.

But when it comes to the science, I’m with Loreau. As a species, we are full tilt ahead on a dark and winding course. Richness is our insurance.
Posted in native plants, restoration, Weather and Climate | Tagged , , , , , , , | Leave a comment

Flowering Time and Temperature Variation

I have been at this for some time with Ben VanderWeide, and hopefully we are nearing publication. The focus of most work to date that studies how variation in temperature affects when things flower has focused on species that flower early. I think people focus on these species, in part, because their early flowering is conspicuous. We are all looking for blossoms in spring. These species also clearly respond to temperature around and immediately before they flower. The prevailing view is that later flowering species are less sensitive to warming. This, however, is not borne out by data from 261 species in the northern Flint Hills of Kansas dating back to 1893.

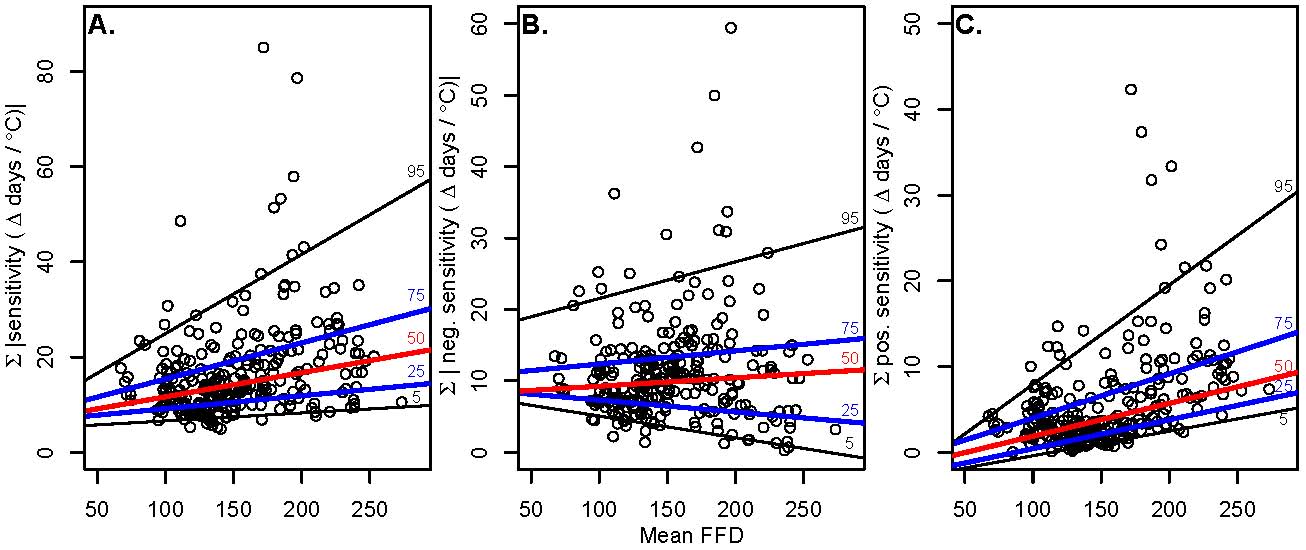
Instead, regardless of when they flower on average, species respond to spring warmth by advancing flowering. Late species, however (and other studies have shown this too) delay flowering in response to warmth during other times of the year, particularly later in summer. The result of this is that later species are actually more sensitive to warming, if one sums sensitivity to warming (slope estimates of regressions of mean first flowering date (FFD) against monthly mean temperatures) across months during the year leading up to flowering. The figure below shows this nicely. Cumulative sensitivity (the sum of absolute values of positive and negative sensitivities) is greater, in general, for species flower later in the year (panel A), and this seems to be because they have greater delays (panel C), while there is not much relationship between mean FFD and phenological advancement (panel B). We used quantile regression, because of heteroscedasticity (more variation for later flowering species), but in panels A and C all positive slopes are significant.

quantilereg3

Posted in native plants, Phenology, Weather and Climate | Tagged , , , , , , , | Leave a comment

What the January?

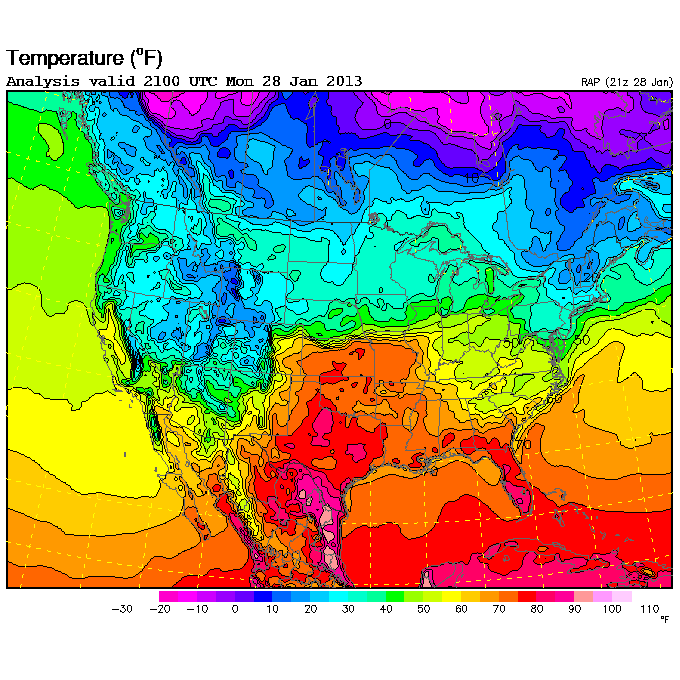
Surface temperature analysis for the afternoon of 1/28.

Surface temperature analysis for the afternoon of 1/28.


I feel like I blog as much about weather as I do about ecology, but the craziness on the plains is impossible to ignore.

Today Topeka, KS surpassed its record high for the MONTH of January. It was 75 degrees. The old record was 74, and the record for the date was 67. It was 76 in Manhattan, KS, but the NWS doesn’t keep extremes records for MHK. Temperatures have surpassed 60 degrees six times this month in Manhattan (30-40 degrees is average).

So what? It is supposed to cool down to slightly below average later this week (before rising back up to the 50-60 degree range).

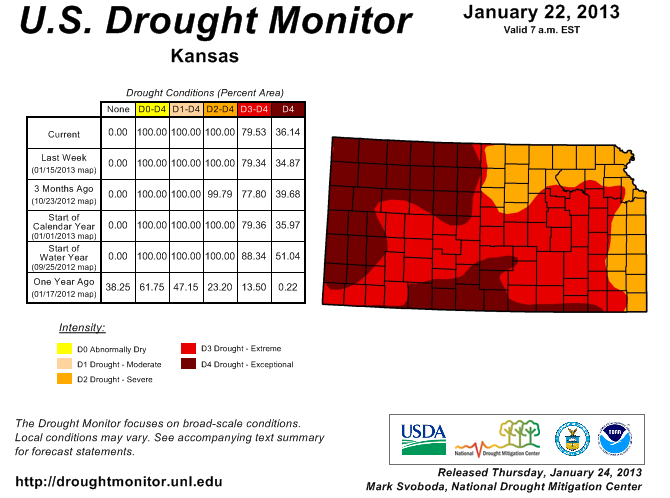
Well, context is key. Look at the most recent drought monitor.

1/22/13 Drought Monitor for KS.

1/22/13 Drought Monitor for KS.

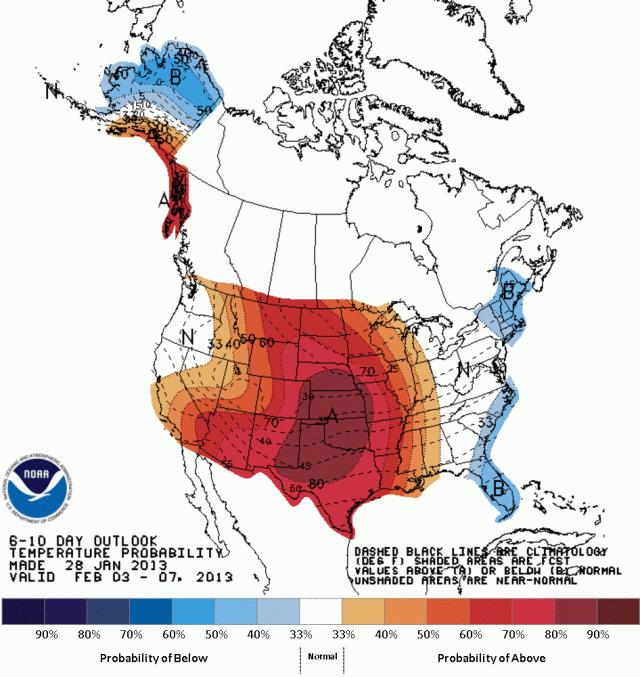
And look at the 6-10 and 8-14 temperature outlooks (precip is equal chances above or below average).

There is a high probability that the plains will be warmer than average next week.

There is a high probability that the plains will be warmer than average next week.

and the week after next as well!

and the week after next as well!

We just keep piling one unprecented event on top of the next. It isn’t for certain that 2013 will see terrible drought on the plains, but it looks more and more likely, and drought in its second, third, or fourth year (depending on where you are from the Dakotas to TX) is going to have consequences for the ecosystems we study, the food we eat, barge traffic, and for some of us, how much we are able to enjoy where we live.

But I’m in Oregon now. Looking at climate change projections, the Great Plains is not the place to be in coming decades.

Update: Manhattan and Topeka also broke records on 1/29 between midnight 2am, 68 and 70 degrees, respectively…70 after midnight in January in Topeka. That is jaw-dropping.

Posted in Weather and Climate | Tagged , , , , , | Leave a comment